
The Macro Code #8 – Pt.2: Inspect the unexpected
The Macro Code #8 – Pt.2: Inspect the unexpected
How useful are future inflation expectations in assessing current inflation?

Welcome to The Macro Code, an open diary on markets, macro-trends and structural changes.
Remember last week's post? We said that inflation, like aircraft, has two main drivers. The first reflects business cost pressures (whether wage-related or related to the price of intermediate goods); the second driver is short- and long-term expectations.
As specified in the last edition of the newsletter, this two-week edition is divided into two episodes:
Episode 1 - already published & available at this link (referring to the first driver of inflation): We have a recap on global inflation dynamics, with a specific focus on bottlenecks along production chains and supply constraints, identifying 5 categories of inflation drivers: Chipflation, Foodflation, Gasflation, Wageflation, and Greenflation.
Episode 2 - available below (referring to the second driver of inflation): We try to understand how useful future inflation expectations are in order to price current inflation. More specifically, we ask whether inflation expectations are useful for getting an estimate of the transience of the current price rise.
There are 5 research questions underlying episode two:
What is the trend in inflation expectations in the US, EZ, and UK?
Why does current inflation depend on expectations about future inflation?
Why are inflation expectations important?
How are inflation expectations measured?
How useful are future inflation expectations in assessing current inflation?
What is the trend in inflation expectations in the US, EZ, and UK?
Many investors are struggling to understand whether the current upward trend in inflation will be temporary or permanent. In reality, this is a flawed line of reasoning. The question to ask is what is the nature of the current inflation and whether central banks decide that it will be temporary or permanent. Understanding the origin of the inflationary process is crucial to directing the path of monetary policy. Unfortunately, the non-economic or financial nature of the crisis we are emerging from fuels uncertainty and question marks.
The pandemic event first froze demand and now, during this gradual recovery phase, there has been a sharp slowdown in supply at the aggregate level. The scenario from a top-down view is as follows: the gradual exit, pushes up the demand strongly stimulated and compressed for a long period and the supply is characterized by various bottlenecks of various kinds: transport, labor, raw materials.
Faced with such factors behind rising prices, the textbook teaches that the central bank must wait to figure out how to move. The crucial point to understand is that waiting to decide how to move is not so much about whether inflation is temporary or permanent but what decision to make, i.e. deciding whether it is temporary or permanent.
To help central banks make that decision, the expectations mechanism comes into play.
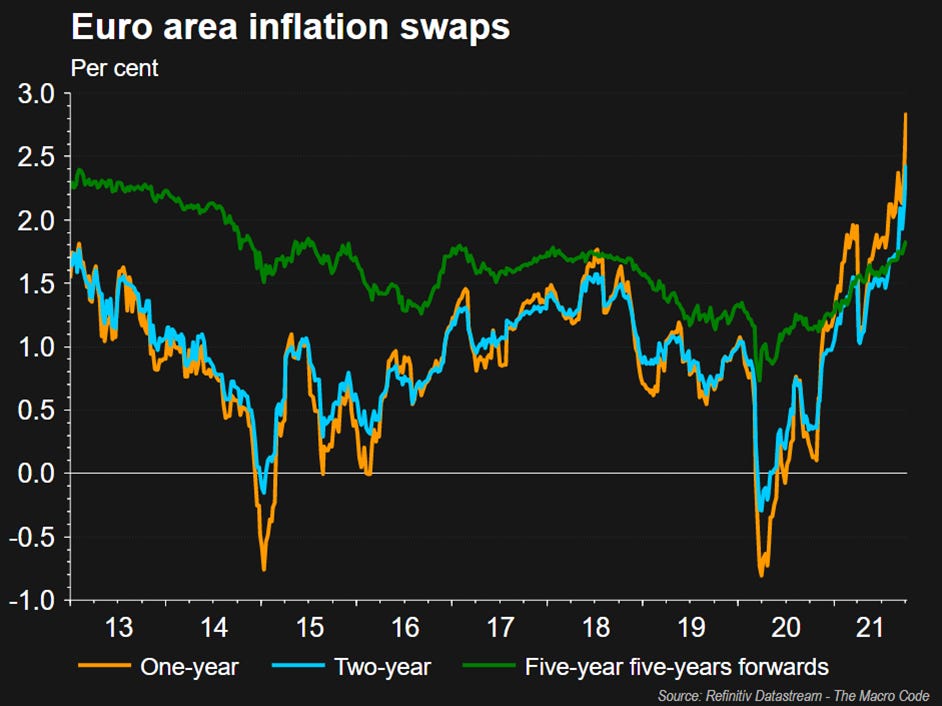
Taking a quick look at inflation expectations as measured by swap options, we see that there is upward pressure in both US and EZ on the 1, 2 and 5 year maturities.

While in the UK, the 5-year inflation swap rate - a market measure of inflation expectations that the Bank of England keeps a close eye on - has just reached its highest in at least eight years.

Why does current inflation depend on expectations about future inflation?
The answer is simple: the main reason is that wage contracts, in nominal terms, are fixed for a predetermined period of time. Let's imagine the unions or a worker at the bargaining table with the company. Since today's salary, expressed in euros, will be so for a certain time horizon (the worker does not recontract his salary every morning when he comes to work), the expectation of future price increases induces workers or unions to demand a higher nominal salary even today, in order to protect their purchasing power. This exerts a push to the rise of the costs of the enterprises and therefore, to chain, on the prices. With a similar logic, if the companies expect that the prices of the intermediate goods necessary to the production can rise in future, they will try to increase the supplyes today, making to grow the excess of demand for semifinished, and to chain the prices of the intermediate goods and the final goods of consumption.
Why are inflation expectations important?
As specified in the previous paragraph, inflation expectations are simply the rate at which people—consumers, businesses, investors—expect prices to rise in the future. They matter because actual inflation depends, in part, on what we expect it to be. If everyone expects prices to rise, say, 3 percent over the next year, businesses will want to raise prices by (at least) 3 percent, and workers and their unions will want similar-sized raises. All else equal, if inflation expectations rise by one percentage point, actual inflation will tend to rise by one percentage point as well.
How are inflation expectations measured?
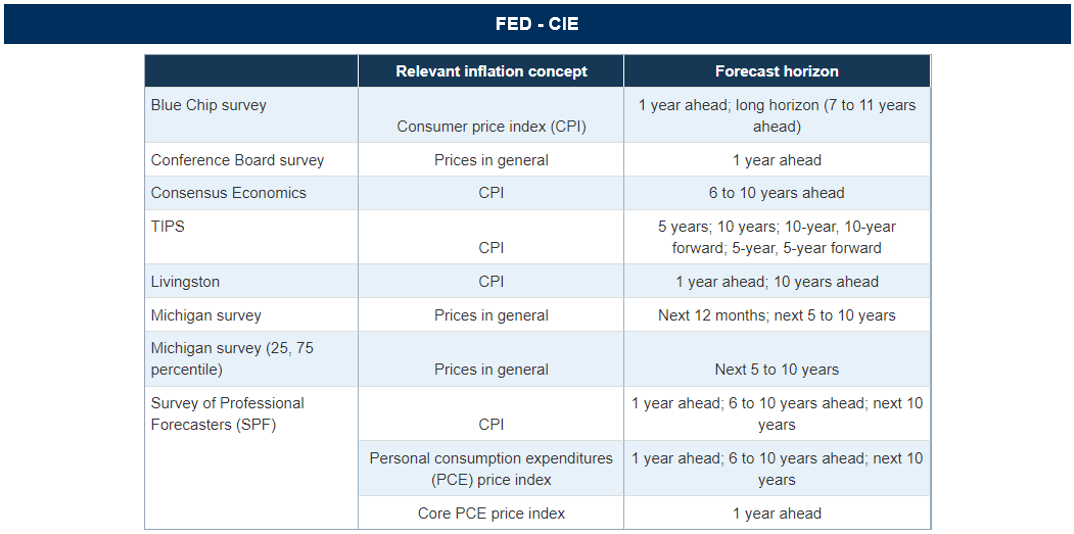
There are three categories of indicators to track inflation expectations.
Survey-based indicators
Market-based indicators
Index of Common Inflation Expectations (US market - but be careful! It is a partial indicator)
Survey-based indicators
One of the most relevant Survey-based indicators is that of the University of Michigan.
The University of Michigan’s Survey Research Center asks a sample of households how much they expect prices to change over the next year, and five to ten years into the future. In addition, the Federal Reserve Bank of New York and the Conference Board field similar surveys.
Another indicator, well known in the Eurozone as it is the Survey-based leading indicator used by the ECB, is the Survey of Professional Forecasters (SFP). This survey is based on responses from financial and other (mainly research) institutions throughout the European Union.
Approximately 60 percent of the panel is made up of financial institutions, and about 80 percent of the panel is in the euro area. For the United States, the Survey of Professional Forecasters is conducted by the Federal Reserve Bank of Philadelphia.
Survey-based information provides a direct estimate of the probability distribution of certain inflation outcomes at certain horizons. However, the drawback here is that the frequency of surveys is quite low and the panel of respondents is in some cases limited.
In addition, empirical evidence has shown that consumer surveys indicate that consumers often perceive a higher level of inflation than is actually signaled by price indices. What, then, determines the perception of inflation?
The academic literature has collected a number of factors on the mechanisms of consumer perception of inflation:
Price increases attract more attention than declines and stable situations and are also remembered longer. On the other hand, we tend to notice stable or declining prices less, which still have an impact in calculating the average inflation rate.
We notice more frequent and in-cash purchases: in recent years, the prices of certain goods and services that are routinely purchased have increased more than the average, including gasoline, bread, and bus tickets. We often pay too much attention to price changes in these items when thinking about inflation, which we may then be inclined to overestimate.
We pay less attention to infrequent purchases and direct charges: a considerable proportion of the household budget is spent on goods and services purchased less frequently, such as cars and vacations. There are also payments that we often make by automatic transfer (direct debits and standing orders), for example for rent or telephone bills. When we think about inflation, we tend to notice these types of expenses and their price changes less.
"Personal" inflation: The Harmonized Index of Consumer Prices (HICP) is based on an average basket of goods and services that is representative for all households. However, those affected by above-average levels of inflation may be more aware of it than those benefiting from lower rates.
Inflation rates are calculated on an annual basis, but with memory, we go back to the more distant past: in general, the 12-month HICP growth rate is shown (this means that the general price level in a given period of time, say January 2009, is compared with that of the same period in the previous year, in this case January 2008), but people's perceptions may be affected by their recollection of prices several years earlier
Looking at the FRED chart below (which compares expected inflation to actual inflation), we will notice that over the past few years, expectations (in red) have consistently been above realizations (in blue). Why?

A critical point here is that, individually, we notice relatively few prices in a measure of inflation. That is, individuals buy fewer goods than are included in the basket that determines the CPI. Moreover, we tend to remember only some of the prices we encounter, particularly those that have changed or changed more than we might have expected.
Empirical evidence on inflationary mechanisms related to individual perception and biases is plentiful.
As an additional point, the following chart shows that there is some alteration in price changes across asset categories. As a result, since expectations of future inflation are largely determined by perceptions of past inflation, the end result is an upward trend in expectations (and this helps explain the previous chart).

Market-based indicators
An alternative way to measure inflation expectations is to use market prices to purchase inflation protection.
Within this category are 2 types of instruments.
Break-even inflation rates (BEIR)
Inflation-linked swaps (ILS)
The break-even inflation rate is the rate that makes the yield at maturity of the nominal fixed-rate security equal to the yield of the real security of the same duration.
The difference between nominal and real rates tells us what inflation is expected in the reference period and therefore the percentage that the market requires in addition to the real rate in order to hedge against inflation risk.
For instance, using the 10-year breakeven inflation rate, the breakeven rate is calculated by comparing 10-year nominal Treasury yields with yields on 10-year Treasury Inflation Protection Securities (TIPS), whose yield is tied to changes in the CPI. The difference between the two approximates the market's inflation expectations because it shows the inflation rate at which investors would earn the same real return on the two types of securities. If investors expect higher inflation, they will buy 10-year TIPS instead of nominal Treasuries, driving down yields on TIPS and driving up the breakeven rate.
An ILS is a contract used to transfer inflation risk from one party to another through an exchange of fixed cash flows.
An inflation swap provides a fairly accurate estimate of what would be considered the break-even inflation rate.
Inflation swaps are used by financial professionals to mitigate (or hedge) inflation risk and to use price fluctuations to their advantage. Conceptually, it is very similar to the way a market sets the price of any commodity, i.e., the agreement between a buyer and seller (between supply and demand), to transact at a specified rate.
Advantages of ILS compared to BEIR
The main advantage of using ILSs to monitor the evolution of inflation expectations is that they provide a broader maturity spectrum than government bonds. Thus they are useful, in particular, for short- and medium-term horizons.
Disadvantages of BEIR and ILS
As with breakeven inflation rates, measures of inflation expectations extracted from ILSs are an imperfect indicator of inflation expectations.
In particular, they are affected by an inflation risk premium and a liquidity premium.
In addition, counterparty risk is also included in the measure of inflation expectations extracted from ILS. However, this risk is usually mitigated through collateral.
ILS rates still contain risk premiums as compensation for exposure to inflation risk.
As with all indicators derived from financial market prices, ILS rates are not immune to the influence of risk premia.
In particular, ILS rates contain an inflation risk premium that compensates investors for the risks surrounding their central estimates of inflation over the forecast horizon.
Index of Common Inflation Expectations (US market)
Federal Reserve economists recently created the Index of Common Inflation Expectations (CIE), which combines 21 indicators of inflation expectations, including readings from consumer surveys, markets, and economists’ forecasts.
The Fed CIE starts with 21 series of inflation expectations. It was not specified why specifically 21 indicators. So, one might ask if it would make a difference if other series or a subset of them were considered? Riccardo Trezzi (former FED and ECB economist), explains here that the difference would be minimal. How so? Because the CIE is essentially driven by a limited number of (essentially long-run) series.
Ideally, the inclusion of such a variety of indicators will produce an index that responds to wide variations in inflation expectations across the economy. At the same time, the different characteristics of the indicators may create challenges for the interpretation of the index.
But the key point here is that the CIE does not provide information on the level of underlying inflation expectations or trend inflation. Despite this limitation, the CIE index can be useful for better inference about the evolution of trend inflation or underlying inflation expectations.
Why? For two reasons:
Because the link between expectations and actual inflation is not yet clear.
Because we can't look at the CIE and say "expectations are at a level of about 2%". That is totally wrong.
Nothing says that 2% in CIE is consistent with 2% actual inflation. In fact, one can try to figure out what level of the CIE is consistent with the 2 percent PCE in two ways: (i) by "brute force," that is, by looking back in history to a time when PCE inflation was about 2 percent and you look at what level the CIE was running at. But this is really brute force because it does not consider any of the shocks in the Phillips curve. (ii) The second way is to use the Fed CIE in a model that endogenously estimates the gap (controlling for slack and supply-side shocks) between actual inflation and the CIE itself.
How useful are future inflation expectations in assessing current inflation?
In the past few weeks, a provocative paper has set off a fierce debate among economists.
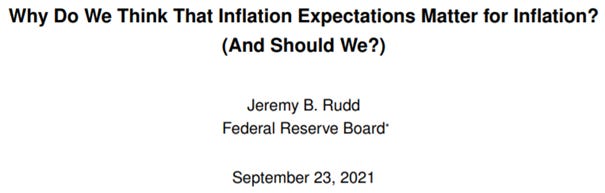
Jeremy Rudd, a well-known Fed researcher, has argued that obsessing over inflation expectations is useless and dangerous. The main message is as follows: just because we expect inflation to show up, doesn't mean it will.
In a nutshell: the Fed raises interest rates when, and only when, it thinks inflation will otherwise be too high. This means that a central bank needs a formula to determine where it thinks inflation will be.

The mathematical expression effectively states that effective future inflation is equal to expected inflation, adjusted by some variables associated with things like unemployment and supply shocks. But, according to Rudd, there is no empirical reason to believe that inflation expectations play a central role in driving observed inflation.
What are the views of some macro researchers regarding the statements in this provocative paper?
According to Riccardo Trezzi (see here), the usefulness of inflation expectations in forecasting inflation has always been close to zero. In an interesting thread on his Twitter account, he imagines being at the inflation desk at the Fed and explains why it is so complicated to use expectations to set up inflation forecasting, via incoming data.
His key messages are below:
Let's start with consumer expectations (these expectations should in theory be important to the consumption decision and could go into wage negotiations). In the US, you can look at the NY-Fed survey but it has problems: (i) it only covers short-term (1-3 years) expectations (whereas in theory and practice it is probably the long-term measures that matter), and (ii) it is a short time series. So, for any practical purpose, the NY-Fed survey is essentially (still) unusable.
But you can look at Michigan. However, Michigan also has problems. For example, consumer expectations have become much more polarized than in the past, there's evidence that consumers are thinking with an anti-Phillips curve mindset, and long-term measures are affected by short-term fluctuations in food/energy prices, etc. As a consequence, are you sure you can interpret an upward movement in Michigan the way it looks? Maybe, but probably not.
Now let's move on to corporations (which are theoretically very important since they are the ones making the prices). Here we have nothing available. There is no nationally representative survey of long-term business inflation expectations.
You can look at the Atlanta Fed survey, but it only covers 1 district. And you can look at the experimental series, but they're short and very rare. So, again, on the business side, you're blinded. And that's not exactly trivial.
So, you move on to the expectations of markets, say TIPS. There are several issues here: first, those are measures of compensation, not expectations (so you need a model to account for liquidity and risk premia). Second, those are measures of total inflation (which is a terrible predictor of future inflation). Third, the predictive power of the market’s measure seems comparable to a constant. Thus, what kind of information do you get from looking at TIPS? The information is not highly relevant (unless, perhaps, you see an extreme movement).
Finally, you can look at professional forecasters (e.g., SPF). The problem with the median of the SPF is that it is essentially flat. You can take that as a generic confirmation of "central bank credibility," but does it really help?
Therefore, in the end you have a number of measures with different horizons/meanings/implications. How do you aggregate them so that you can easily communicate something to policymakers?
The truth is there is no magic ball, no one has it. Hence, what do you have in your hands when you sit down at the table with Powell?
You have a series of signals from different agents; in most cases, you're not quite sure how to interpret them given the above warnings, but you still need to convey a general message of the form "inflation expectations are/remain anchored (or not)" - whatever that means.
Conversely, according to Ricardo Reis, if you're at the inflation desk, forecasting ups and downs over the next 6 months, median expected inflation is not that useful.
But today we are discussing whether there's a new high-inflation regime or a temporary blip. For this, expectations matter, big time.
Hence, you should be skeptical of the claim that survey data give accurate forecasts of inflation. But Rudd’s loud and bold claims “using inflation expectations to explain observed inflation dynamics is unnecessary and unsound”. This is miles away from a sensible reading of the evidence.
Another interesting take on Rudd's paper is from Stay-At-Home Macro, which notes that Rudd's paper is useful in bringing a wind of change to the management of inflation expectations by central banks (and the Fed in particular).
We are living with the highest inflation in decades—though the monthly pace is stepping down and the pandemic, which is the source of many supply chain bottlenecks and labor shortages, is slowly getting under control. And at the same time, the Fed is using a new, untested inflation strategy (the average inflation targeting). The world is tough and forecasting near impossible. Now is not the time to be using broken tools.
According to "Stay-At-Home Macro", Rudd’s style was punchy for a current Fed staffer in public. But he got your attention. He took out a metaphorical two by four and smashed it over the head of mainstream macro. I use that style sometimes too. It’s the only way the old guard might listen. Everyone in macroeconomics and in central banks needs to listen and ask themselves tough questions about inflation.
To explore the topic of how a central bank constructs and considers expectations indicators, the ECB recently published an Occasional Paper entitled: Inflation expectations and their role in Eurosystem forecasting (see here).
The Macro Code is an open diary on markets, macro-trends and structural changes.
To receive updates in newsletter format, follow the form below.