
The Macro Code #10 – Inflation lookout: heading somewhere
The Macro Code #10 – Inflation lookout: heading somewhere
Escaping the inflation transitoriness trap

Welcome to The Macro Code, an open diary on markets, macro-trends and structural changes.
The Fed's inflation debate is still unresolved
New US data released on Friday (see here) show the jury is still out, with the personal consumption expenditures price index rising in September at a 4.4% annual rate versus 4.2% in August, continuing a run of inflation at levels not seen in 30 years. Excluding food and energy costs, the index rose at a 3.6% annual rate in September, matching the rise in the prior three months and a sign that price increases continue even when some of the more volatile items are excluded.
In addition, inflation expectations (with reference to both surveys and inflation-linked bond prices) confirm a sustained level of inflation even over long horizons (5 to 10 years), in clear divergence with the view expressed by policymakers in the major advanced economies, who continue to beat the "transitory inflation" drum, forecasting a decline in inflation rates towards the end of 2022 (see here).
A short period of high inflation could have limited implications for asset prices if the outlook for future inflation remains favorable and the view supporting transient inflation is realized. However, in this new weekly newsletter, we try to clarify why this interpretation may be only partially correct.
While there are good reasons to believe that recent high inflation rates will subside to some extent, there are also a number of factors that suggest that a return to low and stable headline CPI values of ~2% is unlikely in the near term.
In other words, the goal of this newsletter is to provide the tools necessary to escape the inflation transitoriness trap by highlighting those factors that, over a medium-term time horizon (2023/2024), could result in an inflation measure above the pre-pandemic level.
The underlying thesis is that the current rise in inflation is driven predominantly by transitory effects (base effects, supply chain disruptions), but when these factors cease to exist as capacity will be gradually reached, persistent drivers for higher inflation than pre-Covid-19 levels may emerge.
It depends on where you look through the data....
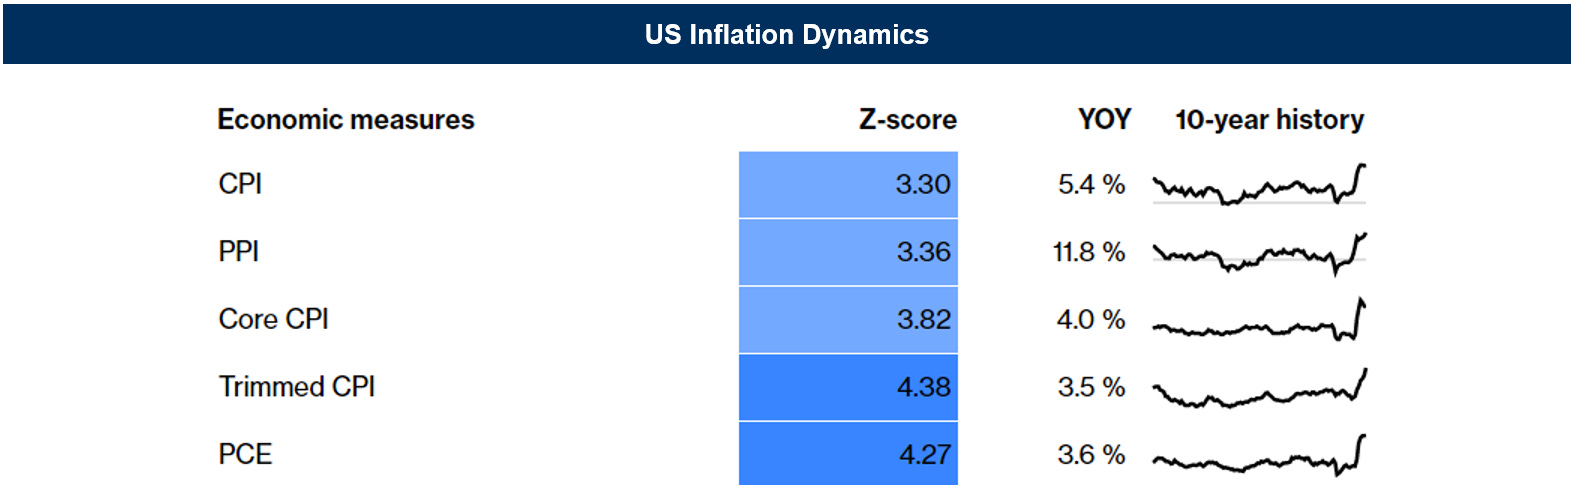
After a series of nasty surprises, the September headline level of inflation settled at 5.4%, barely higher than the level for June. However, it remains very elevated by the standards of the last decade. The core personal consumption expenditure, or PCE, deflator, remains at its highest level since 1991 and is still increasing, while headline inflation (including fuel and food) is still above 5% for the first time since the oil-price spike of 2008. Producer price inflation data are still showing the highest year-on-year increases in four decades. These are sudden moves, and the “trimmed mean” measure, which excludes goods that have suffered the most extreme changes in price in both directions, is more muted. However, this measure, at 3.54% for August, its highest since its 3.62% amid the oil price spike that preceded the financial crisis in 2008, is now looking more extreme compared to the norm than the headline levels — a worrying sign that inflationary pressures are broadening.
Some support for the "transitory" view comes from observing trends in monthly price changes. Indeed, it should be noted that while YoY inflation readings have remained elevated, the momentum in month-to-month CPI changes appears to have slowed down. The 3-month annualized inflation rate came close to 10% in June but fell below 5% by September. Consequently, to better understand why inflation seems unlikely to maintain its recent pace, it is useful to divide the CPI into a number of custom categories relevant to the current environment:
Reopening sectors - e.g. restaurants, air travel and hospitality services. These categories saw price declines at the start of the pandemic last year and have long been expected to see some rebound as health concerns decline.
Auto - vehicle demand has been strong as consumers have avoided mass transit. At the same time, semiconductor shortages have severely limited auto production, leading to undersupply and large price increases, particularly for used vehicles (we covered this in a previous edition of The Macro Code).
Energy - often a big driver of temporary CPI swings. Economists often look at Core CPI specifically to filter out the transitory impact of energy price movements.
Everything else - the largest components here are primary rents and owner-equivalent rent, but this group also includes a diverse set of goods and services that could provide a sense of broader price trends.
Decomposing the 3-month annualized change in CPI into these categories reveals further clarity as to why the "transitory" interpretation has gained traction in recent months. If we look at the drivers of inflation when the 3-month annualized rate peaked in June, most of the increase in CPI can be attributed to reopening items, autos, and energy. New and used vehicles comprised about 7 percent of the total CPI, but accounted for more than 40 percent of the increase in aggregate consumer prices in the three months through June. The impact of these components subsequently began to diminish in the third quarter, providing support for the view that dramatic price movements in areas such as used cars (up 45% in the year to June) and hotel rates (up 15%) would not persist indefinitely.
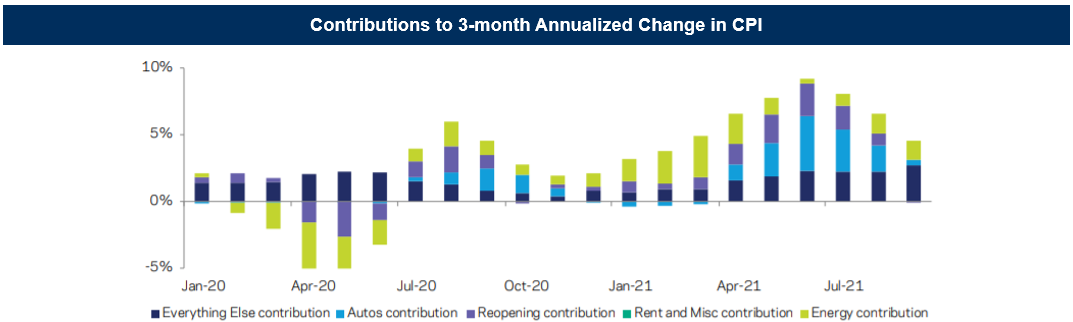
However, if we look beyond the eye-catching movements in autos and reopenings and we focus instead on the residual "Everything Else" category, we find that prices have actually continued to accelerate, approaching a vibrant 5% annualized. In other words, while industry-specific factors may temporarily drive up CPI changes, there is also ample evidence of a broader inflation recovery.

Fiscal stimulus and strong demand
The U.S. economy continues to exhibit extremely strong consumer demand with significant supply-side impediments: a typical scenario for a price spike. The massive fiscal stimulus introduced to deal with the aftermath of the pandemic event has left U.S. households in exceptionally good financial health, with nominal incomes running well above pre-pandemic levels and improved balance sheets thanks to appreciating equity and real estate values.
The cumulative deficit of over $5 trillion since early 2020 has been largely financed through Federal Reserve asset purchases and has been closely matched by a comparable increase in liquid deposits at U.S. banks (see chart below).
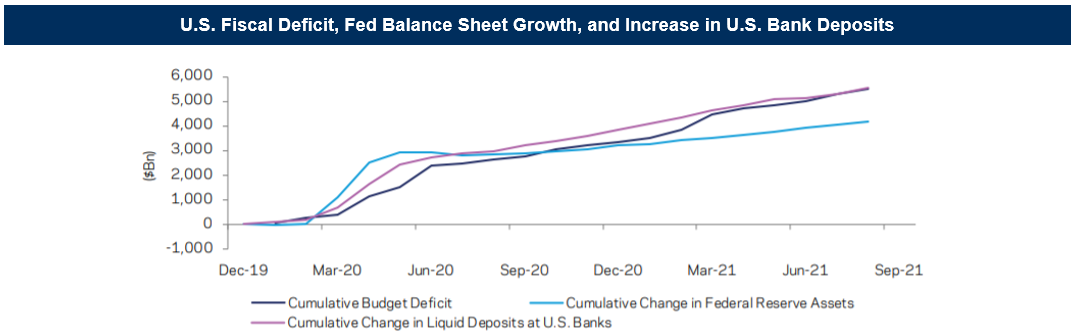
In other words, a cash-funded fiscal stimulus has substantially increased the cash holdings of the private sector. As a result, U.S. consumers have the resources to spend, and they are generally not holding back. Consumer spending figures are now above their pre-pandemic trend, although use of many personal services is still somewhat subdued. Meanwhile, the productive capacity of the economy has not recovered, with labor force participation rates still depressed and supply disruptions underway in several sectors.

The job market
The surprisingly tight state of the labor market could be an important source of upward pressure on inflation over the medium term. While reported unemployment remains high, surveys of households and businesses indicate strong demand for workers and limited supply. For example, the NFIB survey of small businesses in the U.S. showed a record share of firms having difficulty filling available jobs. Trends in wage growth confirm this message, with the Employment Cost Index (ECI) showing the fastest growth in private sector wages since 2007 (see chart below).
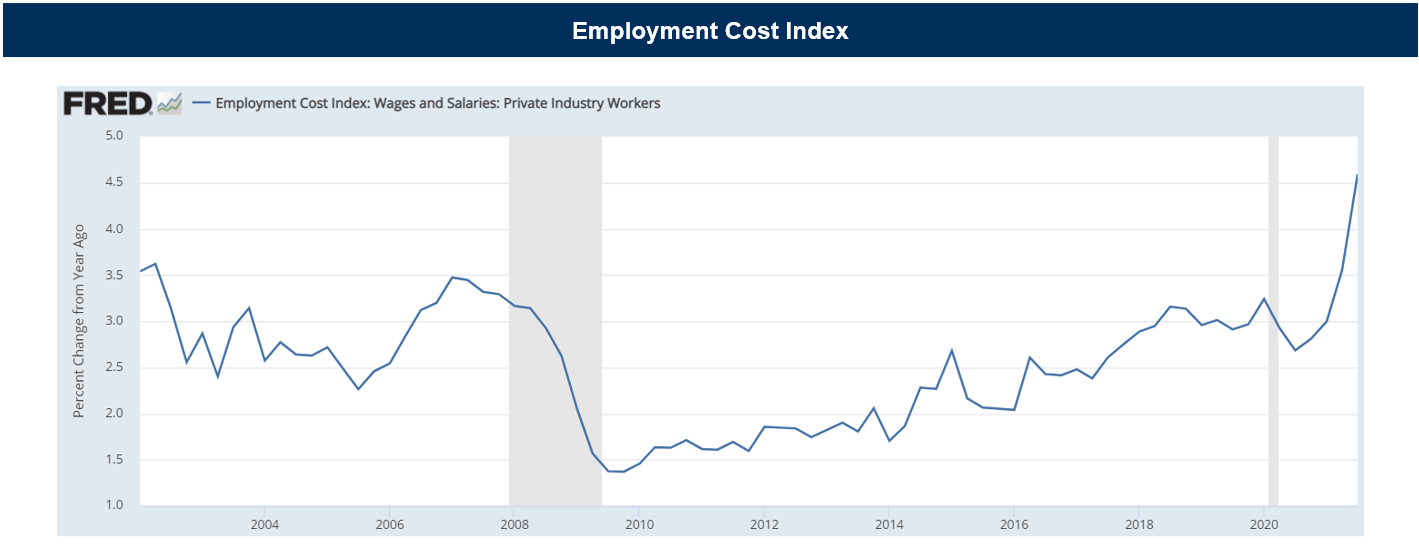
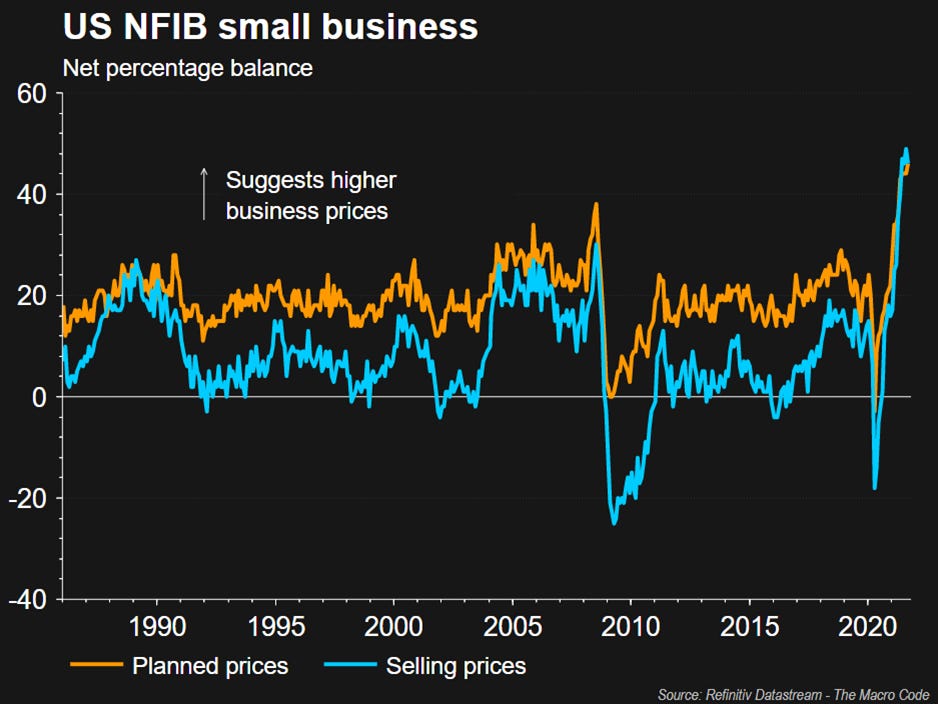
Surveys indicate that household inflation expectations are high, which could motivate workers to demand larger wage increases than we've seen in a while, potentially giving rise to larger and more persistent price increases.

Raw material prices
Commodity prices nearly doubled in 2020. From a geopolitical perspective, this increase reflects a shift in purchases away from China and toward the United States. Strong U.S. demand for commodities is driven by the implementation of the infrastructure plan undertaken by the Biden Administration and for managing the green transition (see here). In response to inflation from higher commodity prices, China began selling off its metal reserves before the summer of 2021 (see here). However, these measures may only help reduce prices temporarily. For example, China's copper reserves are estimated at around 1.5-2 million tons (see here), which is significant compared to potential deficits in 2021/22 of around 300-400k MT, but insufficient if the deficit continues to widen. Thus, China's action may calm prices in the short term, but in the long term, lower commodity prices require more metal supply, tighter monetary policy, or less infrastructure spending.
Supply-chain onshoring
The global shortage of chips has contributed to exacerbate inflationary pressures by causing a slowdown in industrial activity. This shortage can be described as transitory and prices will likely normalize in the coming year (see here). In fact, global industrial activity is already starting to pick up.

However, this shortage highlighted the risks of global supply chain offshoring. The pandemic event signaled that it is appropriate to think about more onshoring of supply chains (see here) around strategic productions as a way to protect intellectual property in a context of increasing geopolitical risk (see here). This trend toward deglobalization will increase the redundancy and robustness of supply chains, but will likely increase production costs and potentially inflation. The OECD had estimated that the advent of globalization in the late 1990s reduced the CPI by 0-0.25 percent per year, in OECD countries (see here).
Asymmetric energy transition
Coal and gas prices have risen dramatically. In addition to the restart, a number of weather and geopolitical factors have limited coal and renewable energy supplies. It has been difficult to bring other energy sources on line. This is putting significant pressure on the prices of available energy sources.

With governments trying to minimize carbon emissions, gas prices have risen even more than coal. All of these events have highlighted an underlying problem: the transition to the net-zero carbon economy so far has been unbalanced, as investment in clean energy has not increased enough to offset declining investment in fossil fuels.
For now, governments may find themselves forced to support greater use of fossil fuels, particularly gas, due to energy supply shortages. Natural gas may emit less carbon than oil or coal, but its main component, methane, is another powerful greenhouse gas. Nevertheless, even methane will eventually have to be phased out if the world is to achieve net-zero. Phasing out natural gas and momentum toward net-zero therefore depends on accelerating the development of clean energy supply.
According to the International Energy Agency (IEA), there has been massive investment in clean energy: an average of $1 trillion per year between 2016 and 2020. More is needed to build a clean and resilient energy infrastructure. A transition to zero by 2050 will require an average annual investment of nearly $4 trillion between 2026 and 2030, the IEA says (see here). A successful transition will need not only clean energy, but also new technologies to store and distribute clean energy, to decarbonize manufacturing, agriculture, and transportation, and to capture carbon emissions.
An orderly, though unbalanced, transition to a net-zero emission economy could have obstacles along the way that could lead to higher inflation. Why?
Consider the rising prices of metals and minerals such as copper, aluminum, nickel, and lithium that are essential to solar and wind power, electric cars, and other renewable technologies.

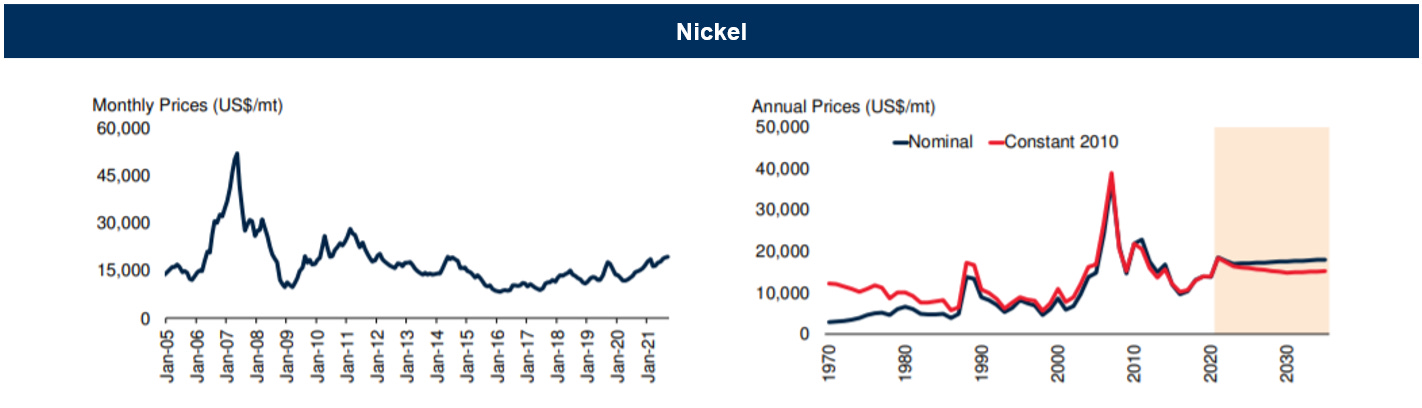
Two of the most important metals for green electrification are copper and aluminum. But investments in these metals have been depressed by companies to comply with ESG criteria. However, the bottom line is that the world needs more copper to stop global warming. Aluminum is one of the dirtiest metals to produce, but it's also one of the vital metals for solar power generation and other green energy projects, and according to the World Bank, it's set to face a particularly strong increase in demand in the coming decades (see here).


The housing market
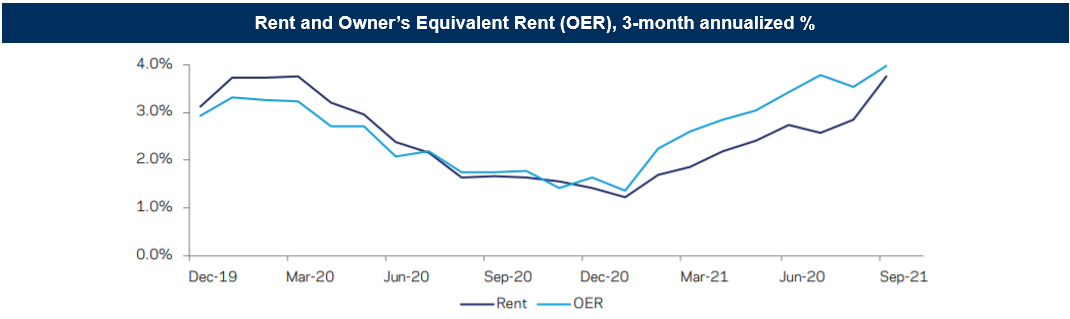
In addition to these top-down drivers, sectoral developments in the housing market may also provide impetus for near-term inflation data trends. Rental costs, including both actual rents and Owner's Equivalent Rent (OER) comprise about 30% of CPI and an even larger share of Core CPI. This segment of the index was somewhat subdued in 2020 and early 2021 as job losses pushed people to move in with families or roommates, mirroring the dynamics seen in past recessions. Just as past cyclical recoveries have typically been accompanied by a pickup in rental inflation, today's improving economy is expected to raise rents over time. However, there are reasons to think that the recovery in rents could be particularly vigorous in the months ahead.
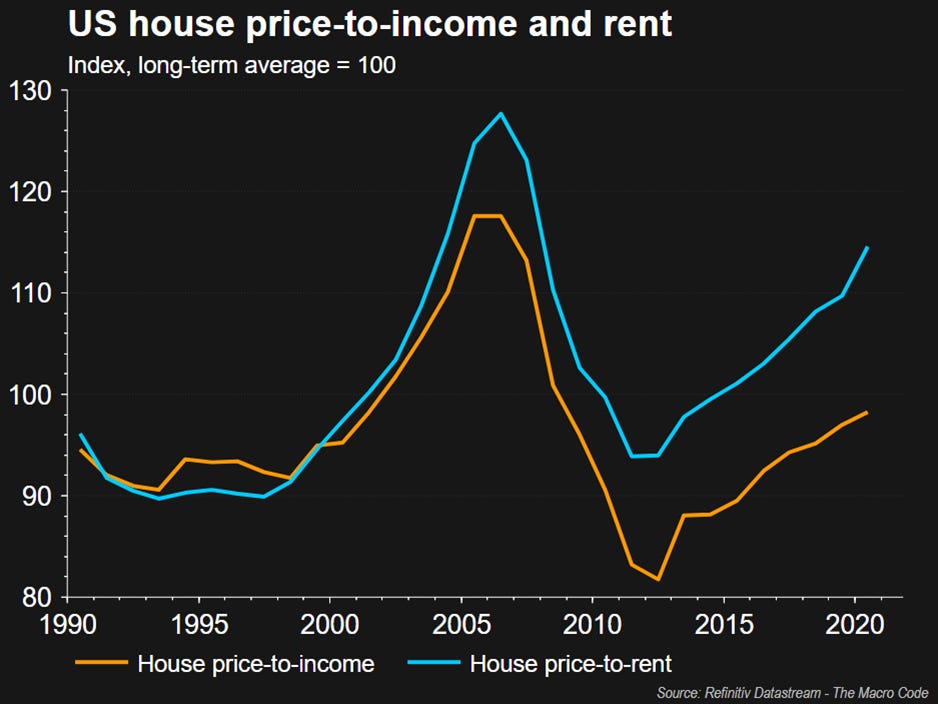
Home prices in the U.S. have risen at a historically rapid pace over the past year, reflecting not only traditional factors such as rising household incomes and low mortgage rates, but also unusually tight inventory and increased demand for living space in a world of social distancing and work from home.

The S&P Case-Shiller index showed national house prices up 19.7 twelve-month % change in August 2021, marking the highest level since the July 2004 peak. Data from the National Association of Realtors indicates fewer homes available for sale in the first half of 2021 than in any comparable period in data back to 1999.

Similar pressures could now impact the rental market as data on asking rents have increased significantly. As leases are reset, the average rents captured by the CPI should catch up to these higher rents. Indeed, recent CPI releases might show the beginning of this process.
Are you sure it is transitory?
In short, those outlined above are multiple reasons why it might be unwise to dismiss recent inflation as entirely transitory. Extreme policy accommodation, vigorous consumer spending trends, labor supply constraints, and housing market dynamics all point toward upward pressure on prices. While CPI readings above 5% may prove to be a near-term spike, a rapid return to pre-pandemic inflation trends seems increasingly unlikely.
The Macro Code is an open diary on markets, macro-trends and structural changes.
To receive updates in newsletter format, follow the form below.
Please, note that The Macro Code represents personal views only.