

The Macro Code #11 – Where are the workers? And how to measure the consumers' temperature?
Workers quit jobs in record numbers. Meanwhile, a reminder about the difference between consumer confindence and sentiment

Welcome to The Macro Code, an open diary on markets, macro-trends and structural changes.
This weekly edition of the newsletter focuses on two relevant market movers related to the U.S. economy:
The Labor Department's monthly Job Openings and Labor Turnover Survey, or JOLTS report, released Friday, reflects an uneven U.S. economy with strong demand contracting against shortages of labor and goods, leading overall inflation to its largest annual gain in 31 years.
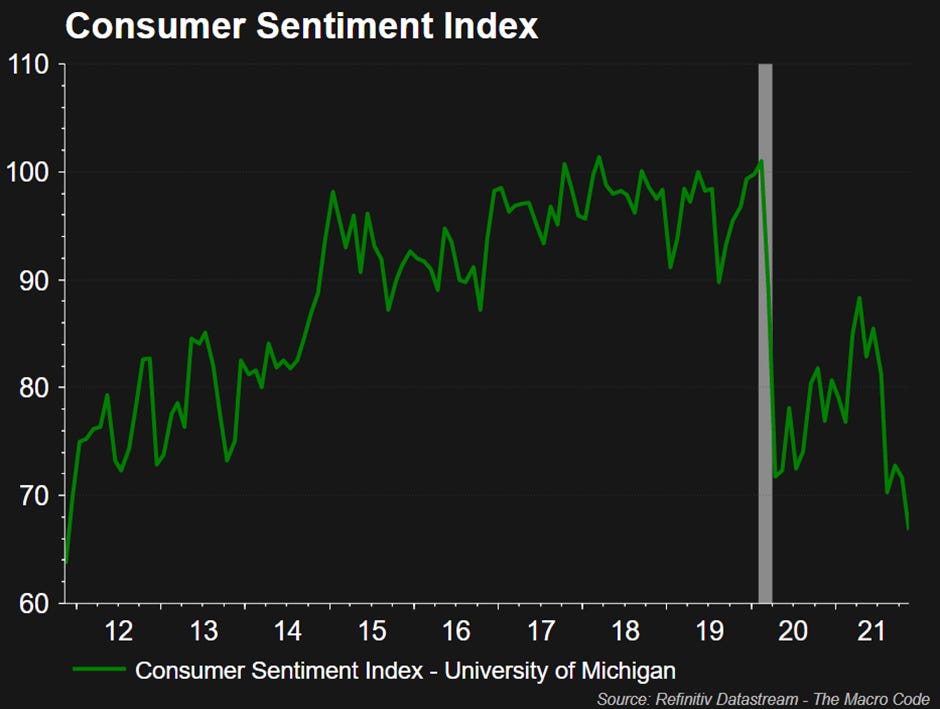
U.S. consumer sentiment plummeted earlier this month to its lowest level since November 2011: according to the University of Michigan survey, the Consumer Sentiment Index fell to 66.8 in its preliminary November reading with a 4.9 gap from October's final reading (71.7).
Pay attention: on this second point, we will focus on a methodological note about a correct interpretation of the indicators of Consumer Confidence and Sentiment.
There are two research questions underlying this methodological note:
1) What role do the Consumer Confidence Index (Conference Board) and the Consumer Sentiment Index (University of Michigan) play in the U.S. macroeconomy?
2) Consumer sentiment and confidence indices: are they leading or misleading guides to future buyer behavior?
Why are these questions fundamental in the current scenario?
The number of Americans voluntarily quitting their jobs rose to a record high in September while job openings stayed stubbornly above pre-pandemic levels (quits rose by about 164,000 in September). Inflation continues to rise in the U.S., October's CPI rose 6.2% from a year ago. Conference Board questionnaires place more emphasis on household reaction to labor-market conditions, while the University of Michigan gauges consumer attitudes on financial and income situation... if you want to get a barometer of the employment situation it's best to look at Consumer Confidence, while to understand how much the current price hike is contributing to darkening consumer perspectives on the economy it's best to look at Consumer Sentiment.
Remember that when it comes to gauging the economy, consumers are king, accounting for upwards of 70% of GDP through their spending. Thus, it is always good to know how the king is feeling... but you need to be able to look in the right direction.
Workers quit jobs in record numbers
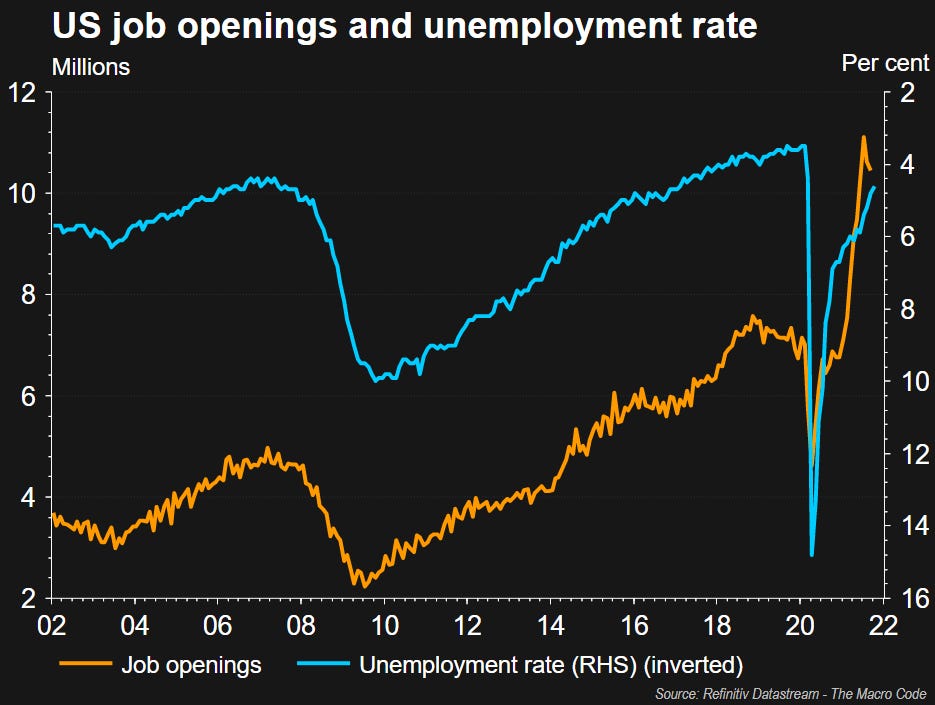
September saw a record high for the number of Americans voluntarily leaving their jobs, while job openings remained stubbornly above pre-pandemic levels, a sign that companies may need to continue to raise wages to attract workers.
Currently, there appears to be some discrepancy between the booming demand for workers and a relatively slow take-up of job openings.
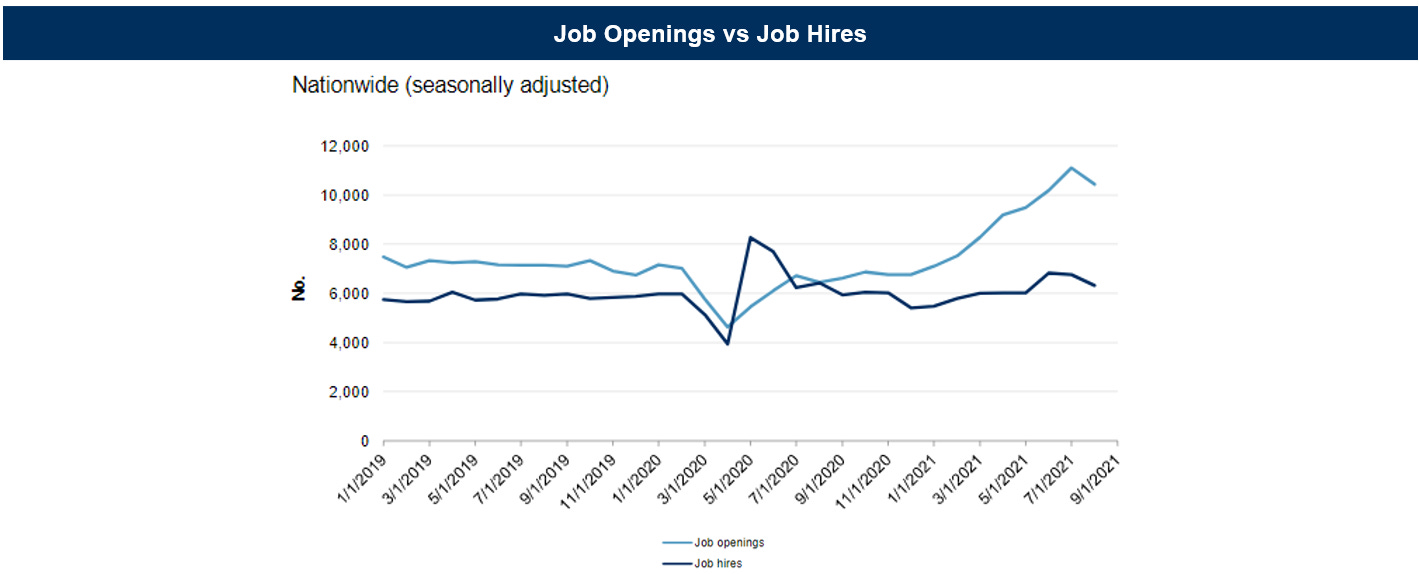
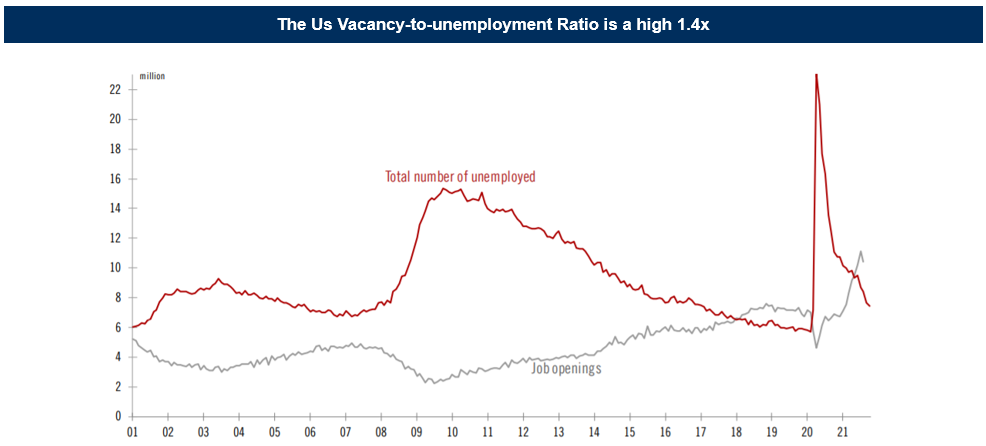
The remarkable discrepancy between jobs and turnover is proof of this: job openings are now almost double the number of hires.
Wage inflation shows little sign of abating even as the daily case rate of Covid-19 infections declines, with employers in nearly every industry competing to attract workers and three million fewer people in the workforce than pre-pandemic levels.
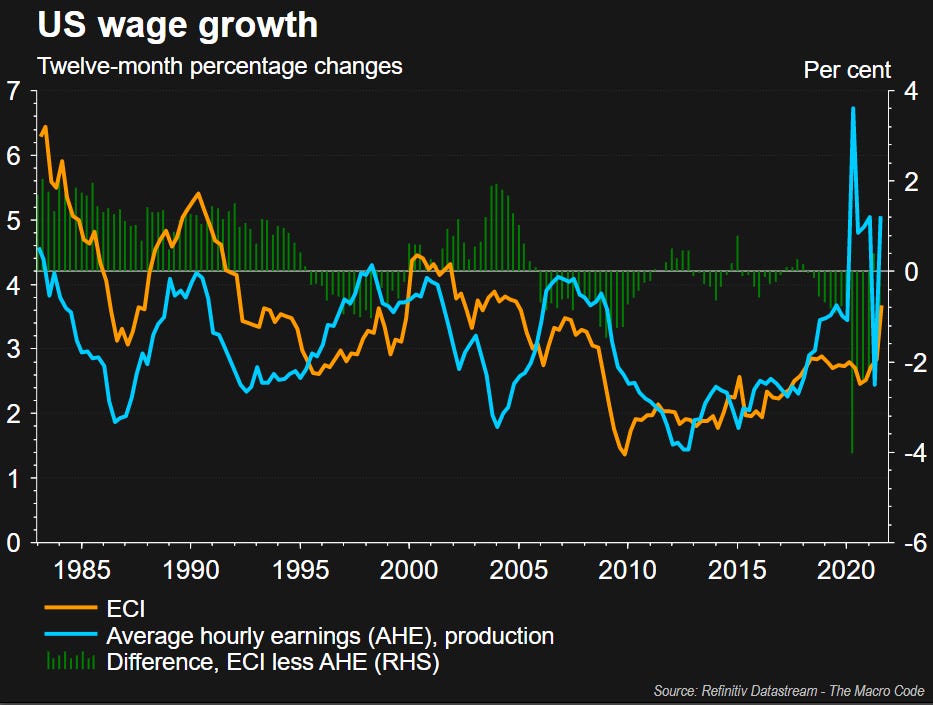
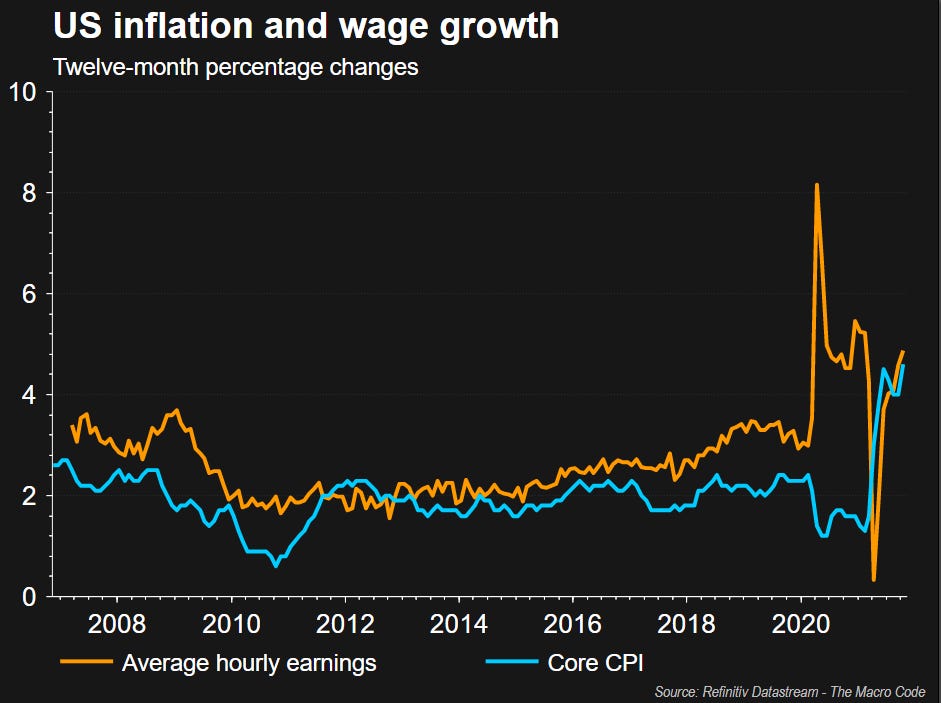
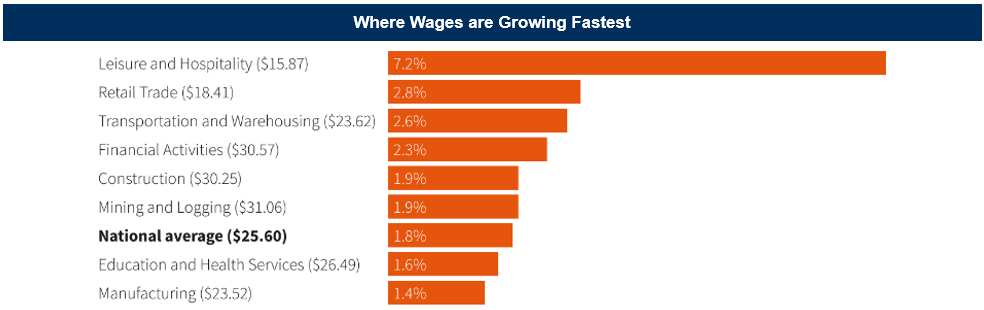
The rush for workers pushed wage growth to a 4.9% annual increase in October, though this was outpaced by overall inflation, leading to a decline in real earnings.
The employment gap from the pre-Covid19 level is a staggering 4.2 million. But it is increasingly difficult to argue that the gap is purely cyclical or Covid-19-related; a large portion appears to be structural, related to fundamental changes since the pandemic, including a surge in retirements (and perhaps also changes in attitudes toward work). Based on August data, the vacancy/unemployment ratio is 1.4 times, the highest since the series began in the early 2000s.
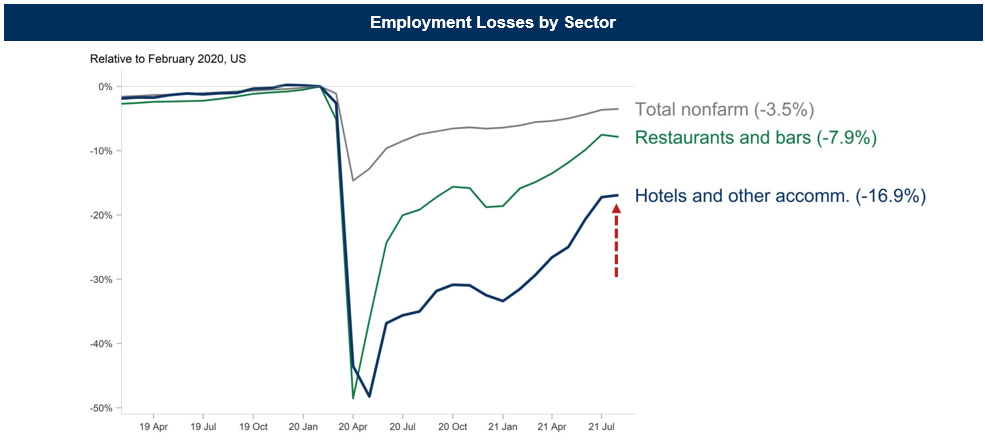
Regarding the change in attitudes toward work, it is interesting to note that there has been an exodus of labor from low-paying jobs, such as in the hospitality industry. The quit rate for leisure and hospitality rose to 6.4 percent, up 0.3 percentage points from a month ago.
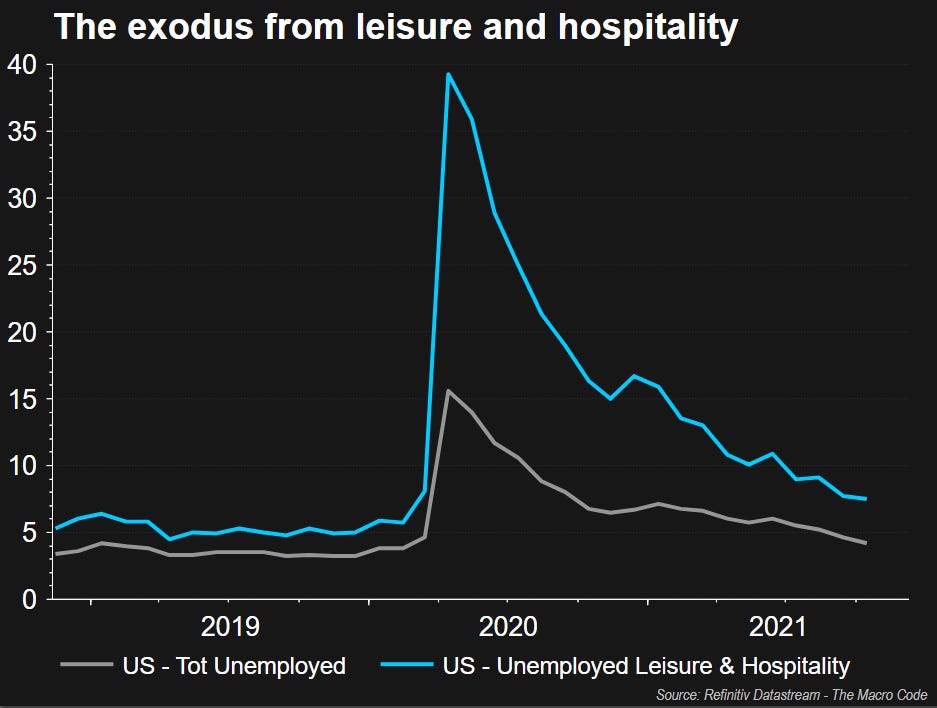
The cost of working in hospitality is likely to remain a challenge: according to a survey, more than 1 in 3 former hospitality workers say they wouldn't consider re-entering the industry, with half saying a pay raise wouldn't change their opinion (see here).
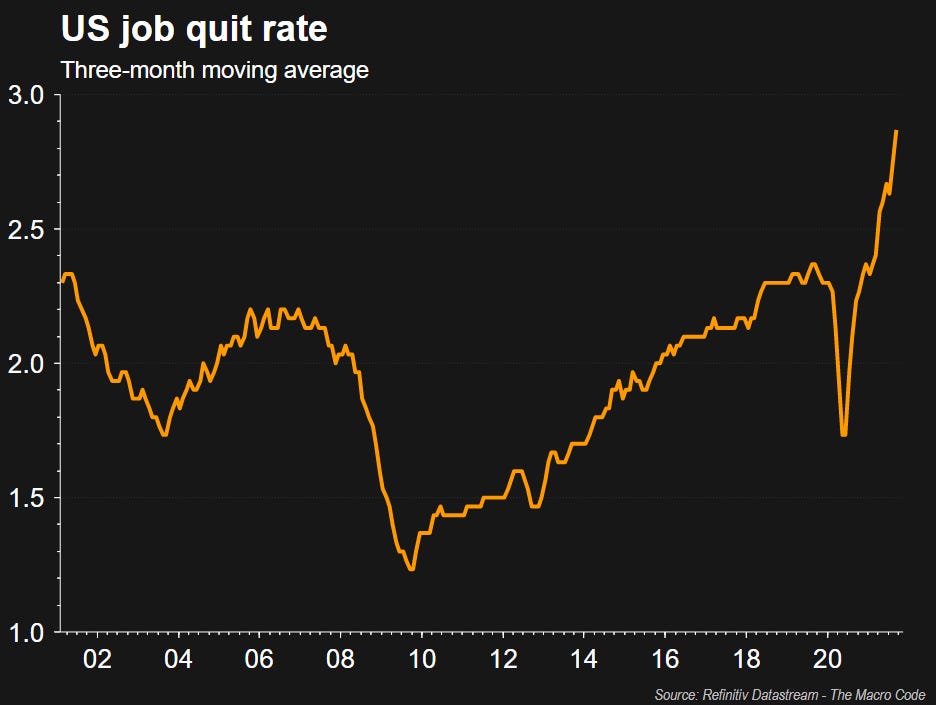
Resignations increased by about 164,000 in September, bringing the total to a record 4.4 million. The quits rate is seen as a good measure of labor market confidence as workers leave when they are more secure in their ability to find a new job.
Looking at the data it seems that those who left their jobs this year have largely moved to higher-paying positions. So there was no negotiation for higher wages within their industry, but workers preferred to move directly to a higher paying industry (see here).
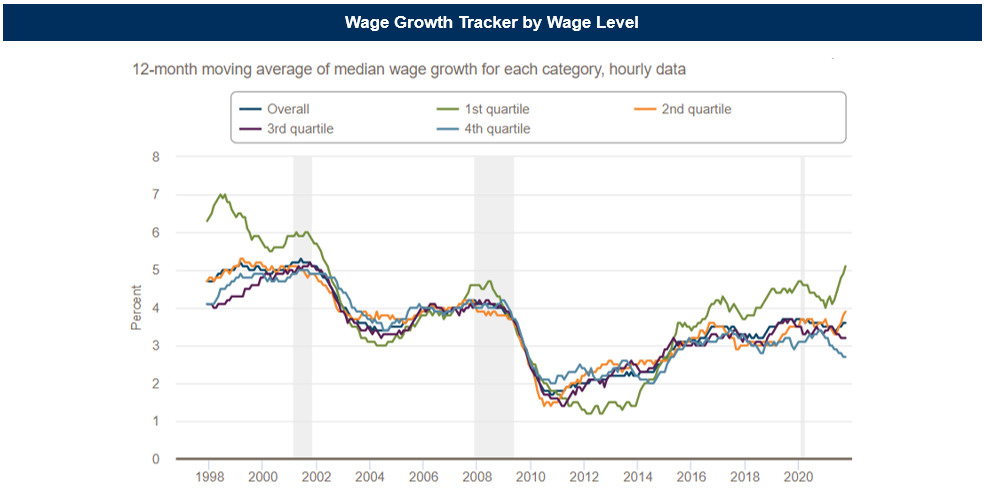
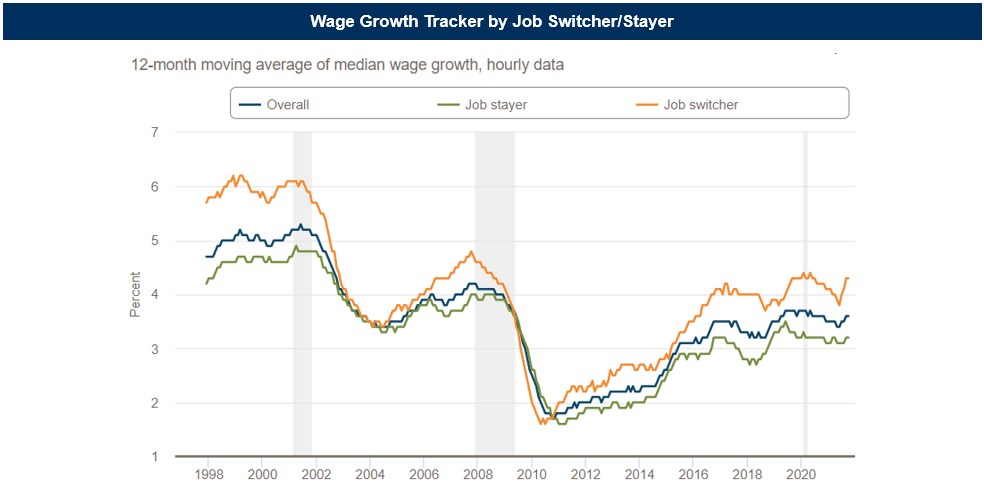
The Atlanta Fed’s wage growth tracker (see here) shows pay up 3.6% overall in September from a year ago, with job switchers seeing a 4.3% increase. Gains have been skewed to higher earners, with the top quartile seeing a 12-month increase of 4.9%.
Job openings, a measure of labor demand, fell by 191,000 to 10.4 million on the last day of September. Hiring was also essentially unchanged at 6.5 million in September.

The government reported last Friday that nonfarm payrolls increased by 531,000 in October after posting gains of 312,000 in September (see here). Employment growth has averaged 582,000 per month this year.
It can be assumed that all-time high savings fueled by government aid, as well as a strong stock market and record increases in home prices are providing a short-term cushion as workers consider when to re-enter the job market. The hope is that as infections decline and schools fully reopen for in-person learning, more people will join the workforce once excess savings aided by generous government aid, some of which has now ended, are exhausted.
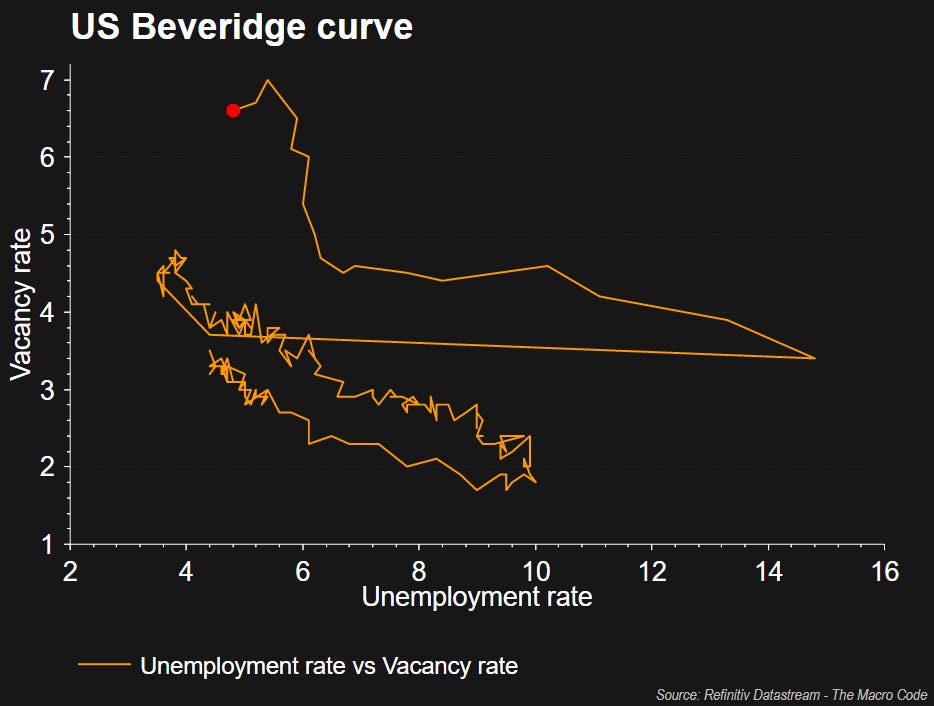
Ultimately, the outward shift in the Beveridge curve, showing a higher level of unemployment than at previous times when the vacancy rate was the same, highlights the misalignment of labor in the U.S. economy.
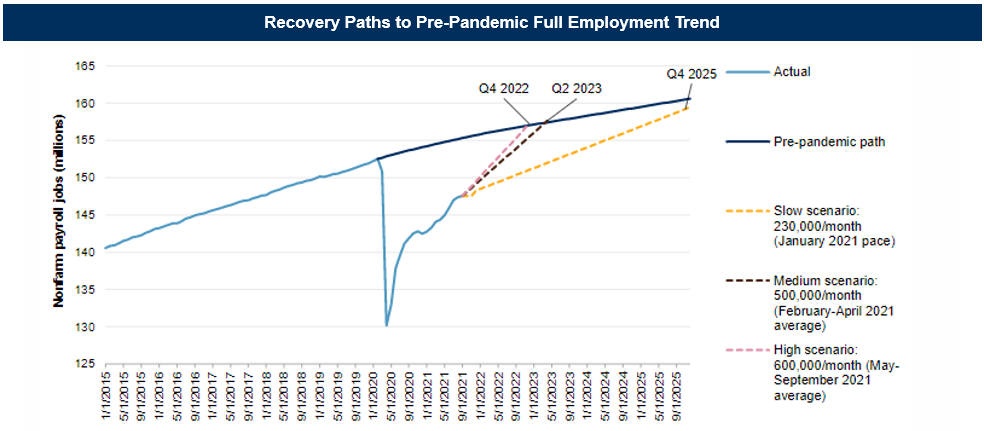
With the lackluster increase in employment, the question remains: where are the workers?
If the current pace of monthly job growth holds steady at about 500,000, the U.S. will not return to its pre-pandemic trend until the second quarter of 2023. However, based on recent weaker-than-expected labor reports, there is a concern that the pace has begun to slow approaching 230,000, which would mean that the labor market will not return to its pre-pandemic trend until the fourth quarter of 2025.
...consumer sentiment hits 10-year low
The University of Michigan's Consumer Sentiment Index fell to 66.8 in its preliminary reading this month, down from October's final reading of 71.7. “One-in-four consumers cited inflationary reductions in their living standards in November, with lower-income and older consumers voicing the greatest impact”, Richard Curtin, the survey's director, said in a statement.
As specified in the introductory section, we now continue with a methodological note for a correct interpretation of the two indicators that measure consumer sentiment: Consumer Confidence Index - CCI and Consumer Sentiment Index - CSI. Taking a cue from the latest publication of the Consumer Sentiment Index (CSI) data from last week mentioned above, the objective of this note is to create a useful reminder to understand which indicator is better suited to analyze the macroeconomic scenario.
Why is this note useful? Because the data published this week on the US market (inflation and labor market) are reflected differently on the CCI and the CSI. If we get into the details of these two indices, we will understand why....
Let's get started:
What role do the Consumer Confidence Index (Conference Board) and the Consumer Sentiment Index (University of Michigan) play in the U.S. macroeconomy?
The Conference Board's indexes are based on surveys conducted by Greenwich, Connecticut-based NFO Research Inc. NFO polls a panel of about 5000 households on their assessment of current economic conditions, their expectations for the future, and their plans for major purchases in the next six months. The Conference Board constructs three diffusion indexes from the responses to five questions: 1) how they rate general business conditions in their area; 2) what conditions they foresee in six months; 3) how they would characterize current job availability in their area; 4) how they think availability will compare in six months; and 5) how they think their family income in six months will compare with their current income. The Consumer Confidence Index is constructed from the responses to all five questions; the Present Situation Index from answers to questions 1 and 3; and the Expectations Index from questions 2, 4, and 5. All three indexes are calculated relative to a base year, whose value is set at 100.
The Consumer Sentiment Index is created from the responses to five questions:
1) are consumers better or worse off financially than a year ago? 2) will the year to come be better or worse for them financially? 3) how will businesses fare in the next 12 months? 4) during the next five years or so, will the country experience good times or widespread unemployment and depression? 5) Is it a good or bad time to buy major household items? Responses are classified as positive, neutral or negative. Two subindexes are formed from different subsets of the five responses: the index of current economic conditions (ICC), from replies to questions 1 and 5, and the index of consumer expectations (ICE), from questions 2, 3, and 4. These three indexes are all constructed using diffusion methodology: the positive responses are added together and the result is divided by the sum of positive and negative responses to yield a relative value.
Now you would think that these two indices would show similar performances month to month, but they often don't. One might point to a pickup in confidence among consumers, while the other might show a decline.
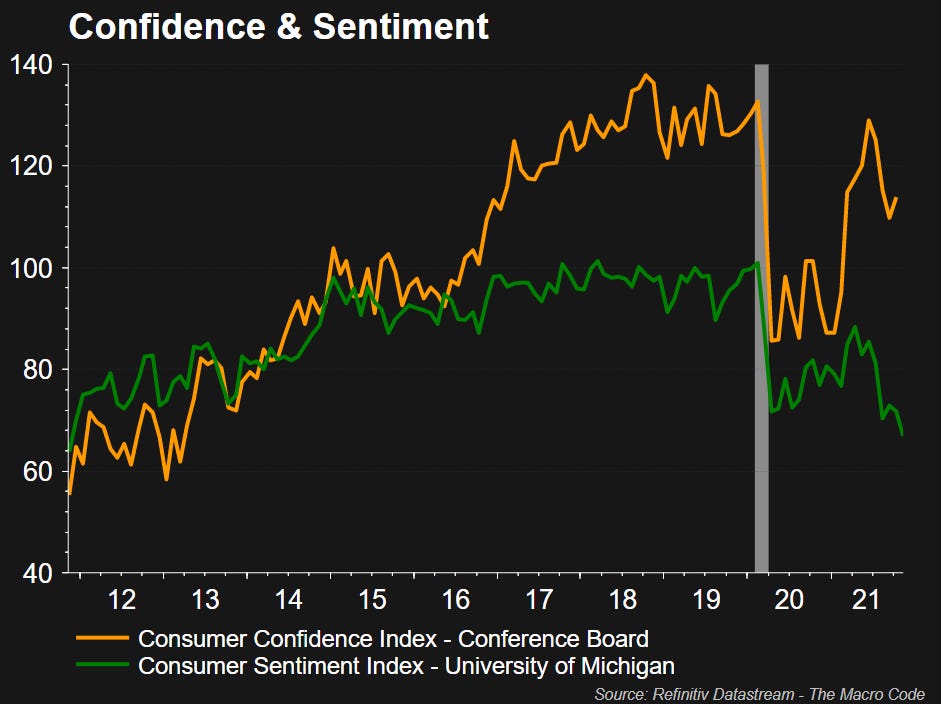
Why such conflicting signals? For one thing, the surveys pursue different approaches. Conference Board questionnaires place more emphasis on household reaction to labor-market conditions, while the University of Michigan gauges consumer attitudes on financial and income situations. This puts the Conference Board survey somewhat at a disadvantage as a leading indicator. The labor market is very slow to react to economic changes. For instance, just before a recession bottoms out, stock prices and consumer spending often rebound. But the unemployment rate tends to stay stubbornly high even long after the recovery has started. In addition, there might be a bias in the Consumer Confidence Index because the questionnaires are mailed out around the time the government releases the unemployment report. So there may be some psychological spillover when respondents fill out the survey. That's less an issue with the University of Michigan's Sentiment Survey because it dwells on personal income expectations, which ultimately are the most important driving force behind consumer spending.
Another crucial difference between the two surveys is that the Conference Board queries an entirely new group of people every month, whereas the Michigan survey goes back to interview many of the same individuals it initially polled. This makes the Consumer Confidence Index more erratic on a month-to-month basis compared to the Sentiment Survey. The two also cover different time frames in their questions. The Conference Board seeks expectations over the next six months; the University of Michigan allows for a much longer period in its expectations component - one to five years.
However, a useful way to exploit sub-index information to predict changes in economic variables is to chart the spread between the expectation measure and the current situation measure.

The reasoning behind this strategy is simple: if the expectations index is less than the present situation index, generating a negative spread, the implication is that people are happier with where they are now than with where they see themselves in the near future. Conversely, a positive spread implies a belief that greater prosperity lies just around the corner, a good sign for spending and the economy. The wider the spread in either direction, the drearier of dreamier future conditions are expected to be relative to the present.
Consumer sentiment and confidence indices: are they leading or misleading guides to future buyer behavior?
The bottom-line question with these consumer surveys is: can they divine future household spending? Not very well, unfortunately. Emotionally based surveys should be analyzed with caution. A single negative report on the economy can lead to mood swings that influence how households respond to a survey. Yet it is unlikely to alter spending patterns in the short run. Indeed, history has shown there is little relationship between consumer confidence and spending on a month-to-month basis. For that matter, there is no methodology, mathematical construct, or statistical model that can successfully predict how human beings will behave in a given circumstance.
This doesn't mean the Consumer Confidence Index is not without some forward-looking merit. It's certainly reasonable to conclude that when households are uncertain about their future, they are more watchful of every dollar spent. By the same token, if Americans are upbeat about the economic outlook, it's logical to think they feel more comfortable about spending. In fact, while the short-term correlation between consumer confidence and spending is pretty slim, it does strengthen over the long term. A six-month or nine-month moving average of consumer confidence levels has proven to be a better indicator of future household outlays. The best advice here is to put less weight on what consumers tell pollsters about their expectations of the future and focus instead on what people are doing with their money right now.
The Macro Code is an open diary on markets, macro-trends and structural changes.
To receive updates in newsletter format, follow the form below.
Please, note that The Macro Code represents personal views only.